
Financial Information

top-bnr-financial-info

1. Trend of Results

International Financial Reporting Standards (IFRS)

(Millions of yen)

2016/3 2017/3 2018/3 2019/3 2020/3
Revenue 95,532 87,638 85,967 99,659 107,023
Change % -3.3% -8.3% -1.9% 15.9% 7.4%
Operating Profit 5,897 4,234 4,912 11,246 17,413
Change % -45.8% -28.2% 16.0% 128.9% 54.8%
as % of Revenue 6.2% 4.8% 5.7% 11.3% 16.3%
Profit before Taxes 5,434 3,628 4,602 11,362 17,181
Change % -53.1% -33.2% 26.8% 146.9% 51.2%
as % of Revenue 5.7% 4.1% 5.4% 11.4% 16.1%
Profit 3,767 2,734 2,898 8,991 13,397
Change % -52.2% -27.4% 6.0% 210.2% 49.0%
as % of Revenue 3.9% 3.1% 3.4% 9.0% 12.5%
Basic Earnings Per Share ¥27.38 ¥19.65 ¥20.97 ¥65.20 ¥97.20

Revenue Operating Profit


2016/3 2017/3 2018/3 2019/3 2020/3
Orders 94,589 88,934 88,542 100,819 107,709
Change % -6.4% -6.0% -0.4% 13.9% 6.8%
Cash Flow from Operating Activities 10,195 9,246 7,946 12,247 14,721
Change % 34.5% -9.3% -14.1% 54.1% 20.2%
Free Cash Flow 1,153 5,581 4,014 11,631 11,035
Change % -24.8% 384.0% -28.1% 189.7% -5.1%

Orders Free Cash Flow


2016/3 2017/3 2018/3 2019/3 2020/3
Capital Expenditures*1 5,399 2,588 3,430 2,436 4,518
Change % -43.8% -52.1% 32.5% -29.0% 85.5%
Depreciation*2 3,736 3,935 3,964 4,031 4,732
Change % 17.3% 5.3% 0.7% 1.7% 17.4%
R&D Expenses*3 13,089 11,212 10,556 12,008 13,321
Change % -2.1% -14.3% -5.9% 13.8% 10.9%
as % of Revenue 13.7% 12.8% 12.3% 12.0% 12.4%
Number of Employees 3,846 3,788 3,717 3,778 3,881

(*1) Capitalized development cost booked as intangible asset for the fiscal year is not included.
(*2) Amortization of capitalized development cost is not included.
(*3) R&D expenses are amounts of R&D investment including capitalized development cost. Thus, these amounts do not agree the R&D expense booked on the consolidated statement of profit or loss and other comprehensive income.

Capital Expenditures R&D Expenses Number of Employees
2-1. Segment Information (Revenue by Segment, Operating Profit by Segment)

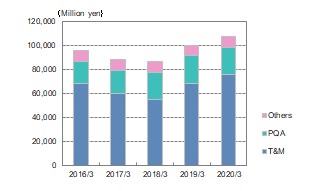
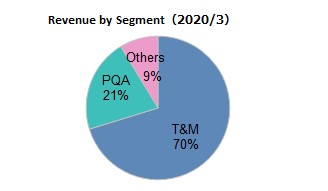
1) Revenue by Segment

(Millions of yen)

2016/3 2017/3 2018/3 2019/3 2020/3
Test and Measurement 67,729 59,333 54,433 68,168 75,165
Change % -7.8% -12.4% -8.3% 25.2% 10.3%
PQA 18,891 19,588 22,549 23,074 22,575
Change % 16.6% 3.7% 15.1% 2.3% -2.2%
Others 8,910 8,716 8,984 8,416 9,282
Change % -3.1% -2.2% 3.1% -6.3% 10.3%
Total 95,532 87,638 85,967 99,659 107,023
Change % -3.3% -8.3% -1.9% 15.9% 7.4%

(*) The name "PQA" has been changed from "Industrial Automation" since April 1, 2015 and it is also restated for the past fiscal years. The Information and Communications segment has been included in "Others" since April 1, 2012. Numbers for FY2011 have also been retrospectively presented in "Others".

Revenue by Segment Revenue by Segment

2) Operating Profit by Segment

(Millions of yen)

2016/3 2017/3 2018/3 2019/3 2020/3
Test and Measurement 4,706 2,130 2,147 9,413 15,148
Change % -47.4% -54.7% 0.8% 338.3% 60.9%
PQA 1,194 1,302 1,969 1,609 1,287
Change % 45.0% 9.0% 51.2% -18.3% -20.0%
Others 575 992 1,458 1,145 1,900
Change % -70.7% 72.5% 47.0% -21.5% 65.9%
Adjustment -578 -190 -663 -921 -921
Change % - - - - -
Total 5,897 4,234 4,912 11,246 17,413
Change % -45.8% -28.2% 16.0% 128.9% 54.8%
2-2. Segment Information (Revenue by Markets)

(Millions of yen)

2016/3 2017/3 2018/3 2019/3 2020/3
Japan 28,565 29,338 29,753 32,183 36,293
Change % 5.3% 2.7% 1.4% 8.2% 12.8%
Overseas 66,966 58,299 56,213 67,475 70,729
Change % -6.6% -12.9% -3.6% 20.0% 4.8%
Americas 23,246 19,633 17,419 26,429 20,773
Change % -4.6% -15.5% -11.3% 51.7% -21.4%
EMEA 13,537 12,520 12,781 12,170 10,693
Change % -14.8% -7.5% 2.1% -4.8% -12.1%
Asia and others 30,182 26,145 26,012 28,876 39,262
Change % -4.1% -13.4% -0.5% 11.0% 36.0%
Total 95,532 87,638 85,967 99,659 107,023
Change % -3.3% -8.3% -1.9% 15.9% 7.4%

(*) EMEA: Europe, Middle East and Africa

Revenue by Markets Revenue by Markets

3. Financial positions, Key Financial Indicators
2016/3 2017/3 2018/3 2019/3 2020/3
Total assets 124,624 125,054 121,190 130,467 138,873
Total equity 75,862 76,485 78,313 85,678 94,331
Equity attributable to owners of parent to total assets ratio 60.8 61.1 64.6 65.6 67.8
Interest-bearing Liabilities 22,159 22,228 16,165 16,435 14,594
Interest-bearing Liabilities Ratio (%) 17.8% 17.8% 13.3% 12.6% 10.5%

Total Equity Interest-bearing Liabilities


2016/3 2017/3 2018/3 2019/3 2020/3
ROE (%)*1 4.9 3.5 3.7 10.9 14.9
ROA (%)*2 3.0% 2.2% 2.4% 7.1% 9.9%
Interest Coverage Ratio: Times*3 52.0 68.4 72.6 124.2 143.3
Dividend Payout Ratio*4 87.7 76.3 71.5 33.7 31.9
Dividends on Equity*5 4.3 2.7 2.7 3.7 4.7
Debt to Equity Ratio: Times*6 0.29 0.29 0.21 0.19 0.15
Net Debt to Equity Ratio: Times*7 -0.20 -0.23 -0.25 -0.33 -0.35

(*1) ROE: Profit attributable to owners of parent/Equity attributable to owners of parent
(*2) ROA: Profit attributable to owners of parent/Total Assets
(*3) Interest Coverage Ratio: Operating Cash flows/Interest Expense
(*4) Dividend Payout Ratio: Total Cash Dividends/Profit attributable to owners of parent
(*5) Dividends on Equity: Total Cash Dividends/Equity attributable to owners of parent to total assets ratio
(*6) Debt-to-Equity Ratio: Interest-bearing Debt/Equity attributable to owners of parent
(*7) Net Debt-to-Equity Ratio: (Interest-bearing Debt - Cash and Cash Equivalents)/Equity attributable to owners of parent

Total Equity Total Assets