Signal Integrity

Introduction to Signal Integrity
Higher data rates introduce new challenges for test solutions. There are several 20+ Gbit/s high speed standards that are driving the upper end of the test spectrum from 40 GHz all the way up to 110 GHz and beyond. Along with the design trade-offs related to choices of vias, stackups, and connector pins, accurate measurements are needed to better understand new challenges related to conductor skin effects and dielectric losses on PC boards. For many of these measurements, it is necessary to collect data that includes higher value harmonic frequencies.
When using Vector Network Analyzers (VNAs) to evaluate backplane and interconnects, one of the most basic considerations is the frequency range over which to make S-parameter measurements. The choice of frequency range affects the ability to locate defects, the correlation between simulations and measurements, and ultimately the ability to make good decisions concerning cost/performance trade-offs.
It’s been a decade since the last major increment in networking data rate. In 2001 the ceiling was raised to 10 Gb/s and, other than a few starts and stops, it has stayed there until now. Finally, in the second decade of the high tech millennium, 100 Gb/s is coming. This is where ultrahigh rate serial data technology converges with mega high rate fiber optic technology. Optical engineers and electrical
engineers alike need to know some of the other’s trade to get ready. This is where using a bit error rate tester (BERT), to test the quality of signal transmission of single components or complete systems is needed.
20+ Gbit/s High Speed Standards
|
Standard
|
Data Rate
|
Number of Lanes
|
|
CEI-25G-SR
|
19.90 to 28.05 Gbit/s
|
1 to N
|
|
CEI-25G-LR
|
19.90 to 25.80 Gbit/s
|
1 to N
|
|
IEEE802.3ba 100GBASE-LR/ER
|
25.78125 Gbit/s
|
4
|
|
32G Fiber Channel
|
28.05 Gbit/s
|
1
|
|
Infiniband 26G-IB-EDR
|
25.78125 Gbit/s
|
1 to N
|
Locating Defects
Sometimes problems are caused by vias, stackup issues, and connector pins. However, frequency domain data alone is not enough; it is necessary to transform that data into the time domain in order to locate the position of particular problems. Passive components, as well as near-end and far-end points between daughter boards must be measured in the frequency and time domains to assure that the transmission characteristics at each measurement point meet the standards. Using the best resolution capability improves your ability to locate discontinuities, impedance changes and crosstalk issues. In addition, many of the structures today are electrically large and put pressure on the measurement solution’s alias-free range.
High Speed Harmonics Increase Required Frequency Range
As bit rates increase, the upper frequency limit for evaluating backplane and interconnect transmission characteristics must also increase. Higher speeds basically translate into higher test frequencies being required to perform measurements to the 3rd or 5th harmonic of the NRZ clock frequency. For example, for a 28 Gbps data rate, this means either 42 GHz or 70 GHz stop frequency for an S-parameter sweep. Attenuating the harmonics of the clock frequency will distort the signal and hence the need to characterize the frequency response of transmission media to higher frequencies – to the 3rd harmonic at a minimum and ideally to at least the 5th harmonic.
S-parameters
Native time domain instruments can provide S-parameters by doing a Fast Fourier transformation (FFT) on the time domain data. Making high quality S-parameter measurements in the frequency domain has some inherent advantages over time domain based instruments, namely dynamic range (DR).
Time domain based instruments are inherently broadband in nature. This bandwidth does net some speed advantages in the measurements, but the very broadband nature of these means that they have significant noise (noise power = kTB, where k is Boltzmann’s constant, T is temperature in Kelvin, and B is noise bandwidth). This increases the noise floor and reduces the Signal to Noise (S/N) ratio. The net effect is a reduction in the DR of S-parameters provided by these instruments.
VNAs on the other hand are inherently narrow band instruments and have lower noise floors because the bandwidth driven kTB noise is much lower. VNAs can measure to an instantaneous IF bandwidth of
10s of Hz which provide very high S/N ratio data and yield higher DR S-parameter measurements.
As a practical example, S-parameters provided by a typical TDR/TDT instrument have on the order of 40 dB DR, where the typical DR of VNA S-parameters is typically greater than 100 dB. This higher quality data can be important when correlating measured and simulated results for channels used in signal integrity applications.
Network Extraction and De-embedding
Many channels used in SI applications have fixtures or connectors required for measurement that will affect the measured S-parameters. Typical fixtures include Baluns, connectors, and/or PCB traces. Having a way to remove these features and structures from the measurement is often very useful. Network extraction is the process of determining the S-parameters for the features that we want to de-embed from (or embed into) the measurement.
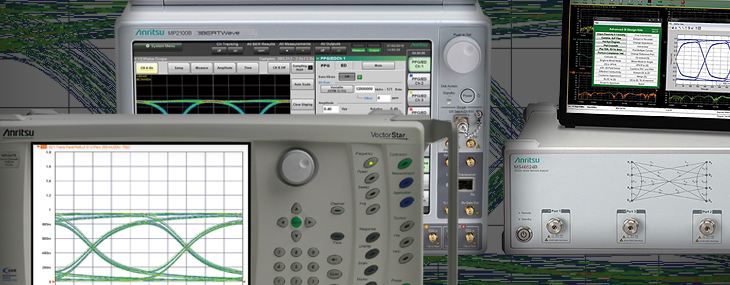
Eye Diagrams in VNAs
The more the insertion loss increases with frequency, the softer the edges will become and the eye will further close in from the sides. Lower frequency defects may create structure throughout the eye, not just the edges. Jitter will cause a general edge broadening while additive white Gaussian noise (AWGN) will cause a more complete line broadening.
The eye will be based on the data and the parameter in a current trace and will update as the underlying frequency domain data updates. It is possible to have traces in the same channel with frequency domain data, regular time domain results, frequency with time gate results and eye diagrams simultaneously.
The data waveform is constructed in time domain using the parameters entered and this is convolved with the lowpass time domain representation of the current frequency domain data. Eye diagrams will not be available if the current frequency list does not support lowpass time domain (i.e., the start frequency is not multiple of the step frequency).
If the bandwidth of the current data is far below the frequency content of the requested data waveform, a very flat, low-amplitude eye diagram will result. If the current data suggests a much larger bandwidth, the eye diagram will approach that of the input data waveform overlaid on itself.
If the DUT is electrically very long (more than an alias free delay ~ 1/ (frequency step)), the calculation may have difficulties. Using a reference plane shift to reduce that length can help as can reducing the frequency step size in the measurement.
Since the output of the calculation is a time domain waveform, the result will always be real. Most graph types are allowed due to some unique application requirements but the Real graph type is the most commonly used. The scale will be labeled in Units but the values are in volts with the results driven by the input signal levels specified by the user.
Any response parameter can be used for the calculation. S21 is the most common selection in a 2-port system but all transmission parameters are frequently used. Reflection parameters are normally only studied this way in specialty applications.
PAM4
PAM4 brings loss levels down to acceptable specifications but the trade-off is an incremental leap in signal complexity. PAM4 also introduces potential nonlinearities. Variations in the eye heights of the three “eye” openings is called “eye compression.” Similarly, “timing skew” occurs when the centers of the three eyes are misaligned.
Signal integrity engineers must still contend with jitter, noise, and crosstalk when measuring PAM4 signals. Very clean clocks, robust clock recovery circuits, and sensitive symbol decoders/voltage slicers are all necessary. In fact, three slicers are required to decode the four possible symbols. Better equalization schemes at both the transmitter and receiver to address inter-symbol interference (ISI) caused by the channel are necessary with PAM4 designs.
Crosstalk
A 100 Gb/s signal has a bit period of 10 ps and a 25 Gb/s signal has a 40 ps period - there isn’t much time for the eye to open. Consequently, extreme data rates require lightning fast rise and fall times. The closer a digital signal approaches the square - wave limit, the more high frequency harmonics are introduced. The high frequencies cause ringing at the slightest impedance mismatch, but that’s not the worst of it. Fast rise and fall times generate violently changing electric fields, and changing electric fields are precisely the cause of electromagnetic radiation. It is a breeding ground for crosstalk.
Noise
Modulation of the optical signal presents several intriguing challenges. The standard on - off, Morse code - style, non - return to zero (NRZ) formatting of digital optical signals suffers as rates increase: as pulse widths get smaller, the optical bandwidth increases. As the optical bandwidth increases, so does the minimum possible wavelength spacing. Increased optical bandwidth also exacerbates both Chromatic and Polarization Mode Dispersion (CD and PMD). Plus, the increased power during high logic levels aggravates nonlinear interactions within the fibers and generates noise.
E/O & O/E
As fiber and free-space optical communication bandwidths increase, the need for very high speed optical modulators and detectors has also increased. The frequency response characterization of these electrical-to-optical (E/O, modulators sometimes integrated with lasers) and optical-to-electrical (O/E, detectors and receivers) converters can be important in terms of such parameters as bandwidth, flatness and phase linearity. The VNA has a number of measurement utilities to facilitate this kind of analysis and, coupled with an O/E calibration module, some level of measurement traceability is possible.
White Papers
Application Notes
Application Brief
Webinar
VNA Reflections is an educational blog discussing leading trends in vector network analysis, emerging VNA applications, fundamentals of VNA measurements, and technological advances in VNAs.
Products

MS46524B
ShockLine 4 port VNA
50 kHz - 8.5, 20, 43.5 GHz freq
140 dB max Dynamic Range

MP2100B
All-in-one Tester combines a BERT (4ch x 12.5 Gbit/s) and sampling oscilloscope (optical 9 GHz; electrical 25 GHz).

MP2110A
All-in-one Tester combines a BERT (4ch x 28.2 Gbit/s) and sampling oscilloscope (optical 35 GHz; electrical 40 GHz).